Table of Contents
Configuring DDoS and BotNet Detector Based on QoE
The detector allows automatic monitoring of incoming traffic, identifying DDoS attacks, and quickly taking measures to protect the network. When a threat is detected, the system can fully isolate the malicious stream or clean the traffic while maintaining service availability for users.
The solution requires SSG version BASE, COMPLETE, or BNG with additional options and is deployed on an existing server with QoE.
1. Updating QoE
On the QoE server.
Update QoE to the latest version, stopping the receivers beforehand. Before starting receivers, patch ClickHouse:
dnf --refresh install clickhouse-patched
Start the receivers.
2. Updating GUI
On the GUI server.
Update GUI to the latest version. Connect GUI to VAS Cloud if not already connected. Enable the aniddos license option.
In the file /var/www/html/dpiui2/frontend/env.js set the option AppEnv.DDoSAttack_isVisible = 1;
3. Installing the Detector
On the QoE server.
Install the mitigator package fastm_qoe on all nodes:
dnf install fastm_qoe
Switch Python version:
dnf install -y python39 python39-devel -y
sudo update-alternatives --install /usr/bin/python3 python3 /usr/bin/python3.6 60
sudo update-alternatives --install /usr/bin/python3 python3 /usr/bin/python3.9 70
sudo update-alternatives --config python3
Select version 3.9:
python3 --version
4. Configuring the Detector
On the QoE server.
On all nodes, or on selected ones:
- Edit the file
/var/fastm_qoe/etc/.env.
It should contain the following:ANALYZER=avg-based-z-score ANALYZER_RULES_KEY=avg-based-z-score-any IDLE_MODE=1 FORCE_MODE=0 DB_DROP_TABLES=1 FM_ATTACKS_METRICS_BY_SUBS_FILTER="and has_attack = 0" FM_ATTACKS_METRICS_BY_SUBS_LIMIT=1 FM_ATTACKS_METRICS_BY_SUBS_COLLAPSE=1 FM_ATTACKS_METRICS_BY_SUBS_DAY='day_'
- Update schema:
fastm-db-scheme
- Enable metrics collection
Add to file/var/qoestor/backend/.envthe following:FM_FULLFLOW_HOOK_ENABLE=1 GEO_IP_DIC_AUTOLOAD_ENABLED=1
Execute the daily cron:
sh /var/qoestor/backend/app_bash/cron_daily.sh
Collect metrics for several hours, ideally 24 hours. Then edit
/var/fastm_qoe/etc/.envagain and change 2 parameters:IDLE_MODE=0 DB_DROP_TABLES=0
This activates the detector.
5. Trigger Thresholds
In the file /var/fastm_qoe/lib/rules/config.json, edit the section avg-based-z-score-any as follows:
"avg-based-z-score-any": {
        "octets": { "th": 100, "weight": 0.1 },
        "octets_dropped": { "th": 1000, "weight": 0.3 },
        "packets": { "th": 100, "weight": 0.3 },
        "packets_dropped": { "th": 1000, "weight": 0.3 },
        "flows": { "th": 100, "weight": 0.4 },
        "sessions": { "th": 100, "weight": 0.4 },
        "duration": { "th": 100, "weight": 0.01 },
        "host_ips": { "th": 100, "weight": 0.3 },
        "protos": { "th": 100, "weight": 0.3 },
        "bits_sec": { "th": 100, "weight": 0.05 },
        "bits_dropped_sec": { "th": 1000, "weight": 0.05 },
        "packets_sec": { "th": 100, "weight": 0.05 },
        "packets_dropped_sec": { "th": 1000, "weight": 0.05 }
    },
6. Metrics Storage (DDoS Attack Logs)
In the GUI web interface, configure storage of raw and aggregated metrics, as well as raw and aggregated attack logs.
In Admin → GUI Configuration → QoE Stor: set DB retention time values as follows:
QOESTOR_FM_ATTACKS_MAIN_LOG_PARTITIONS_LIFE_TIME_HOUR=720QOESTOR_FM_ATTACKS_AGG_LOG_PARTITIONS_LIFE_TIME_DAYS=30QOESTOR_FM_METRICS_MAIN_LOG_PARTITIONS_LIFE_TIME_HOUR=72QOESTOR_FM_METRICS_AGG_LOG_PARTITIONS_LIFE_TIME_DAYS=7

7. Attack Analysis
Detected attacks can be examined in the DDoS attack sections in QoE Analytics.
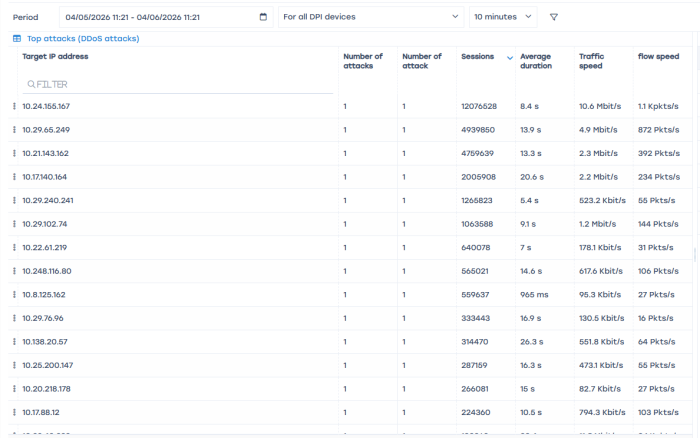
- Start with the "TOP Attacks" section for the last 24 hours.
Sort attacks by number of sessions and note a few IPs with the highest session count.
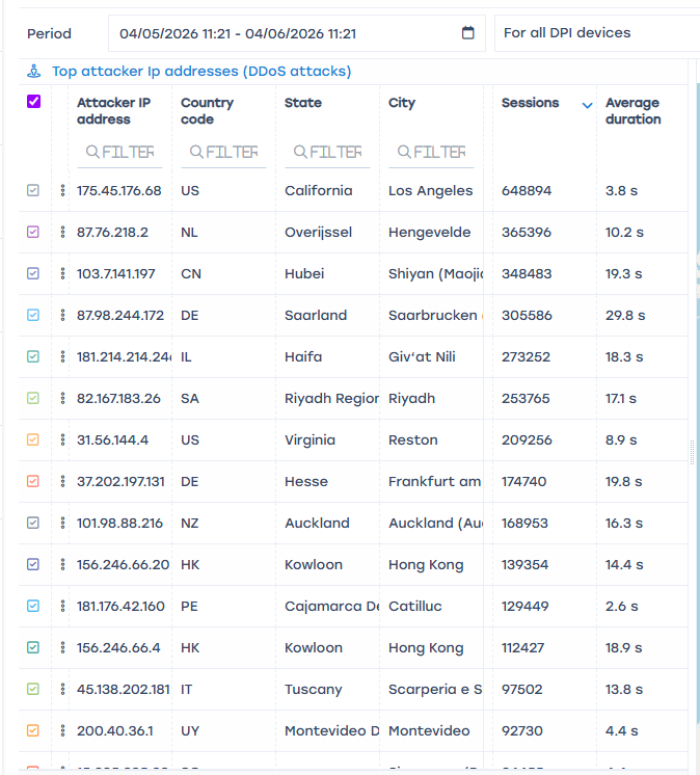
- Check the "TOP Attacks by Protocols" section
Also sort by session count. Note these protocols. - Check the "TOP Attacking IP Addresses" section, note a few IPs with the highest session count
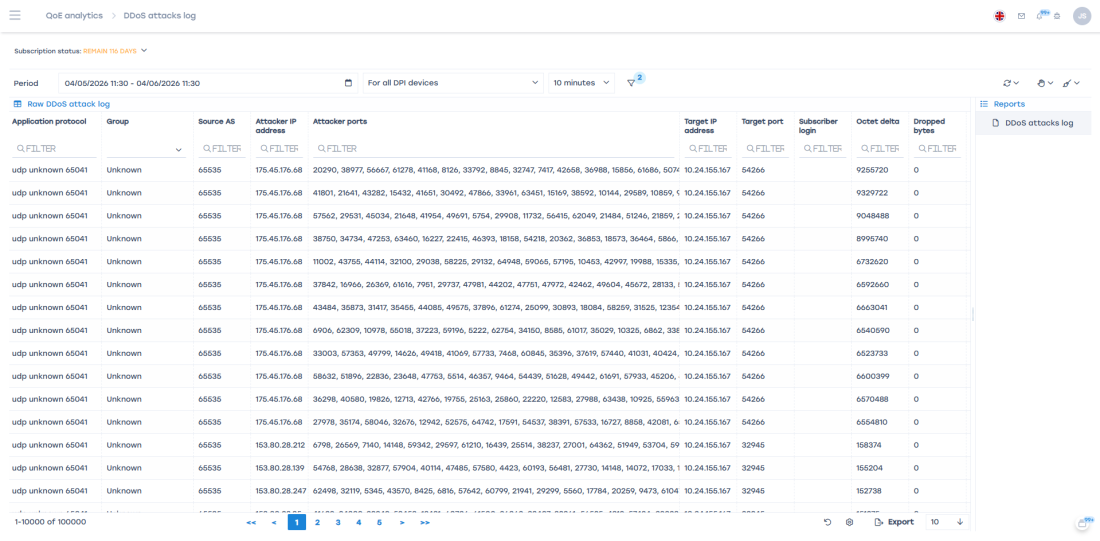
- Analyze the Attack Log with a filter by previously selected subscribers and protocol.
You can extract attack details and make additional conclusions to take appropriate actions.
For example, in the screenshot below it is clearly visible that there is port scanning on the same address using the UDP protocol. In this case, it is sufficient to assign adroppolicy for the application protocoludp unknownto the attacking subscriber profile using session policing (service 18).
This means that for the selected subscriber, all traffic matching this protocol will be completely blocked, i.e., both UDP flood and legitimate UDP traffic identified by DPI as udp unknown.