Table of Contents
"Online Reports" module
Purpose
The Online Reports module allows real-time monitoring of a subscriber’s current traffic state to assess connection quality based on multiple metrics, as well as monitoring the network state for DPI configuration debugging during initial setup or changes. More details on usage cases can be found here.
The structure of online reports is the same as in the “NetFlow” section, but with some differences:
- Monitoring is performed for only one subscriber or one host.
- The aggregation interval can be as low as 5 seconds (instead of 15 minutes in NetFlow), which provides near real-time visualization.
Quick start
- Go to “QoE Analytics” → “Online Reports”.
- Set the “Aggregation period” value.
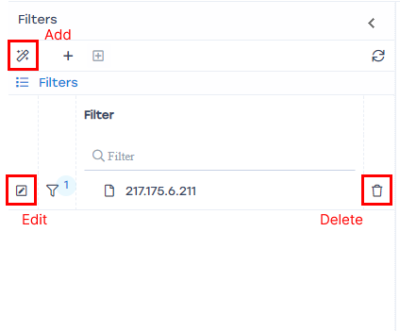
We recommend setting it close to thenetflow_timeouton the sender side. If aggregation periods shorter than 10 minutes are unavailable, configure QoE according to the setup instructions. - Configure flow capture. On the “Filters” dashboard, click the “magic wand” icon and select the required flow capture type. Enter the subscriber’s login/IP or the host/IP of the monitored target.
Host flow capture — analysis of traffic to a specific host.
Data collection starts immediately, and over time the graph fills with more data.
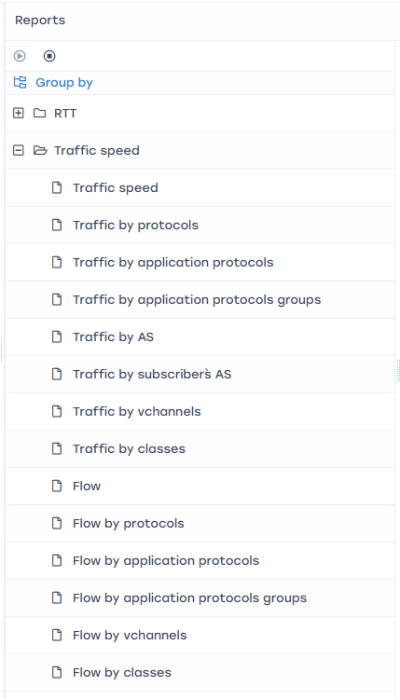
To control data collection, use the “Start data collection” and “Stop data collection” buttons in the upper-left corner of the “Reports” dashboard:
In the “Full raw log” field (below the graph), you can view which flows are currently active for the selected subscriber or host protocol.
Various reports are available for the selected subscriber or host, listed on the left side of the window. These are the same as in the regular “NetFlow” section but display live data.
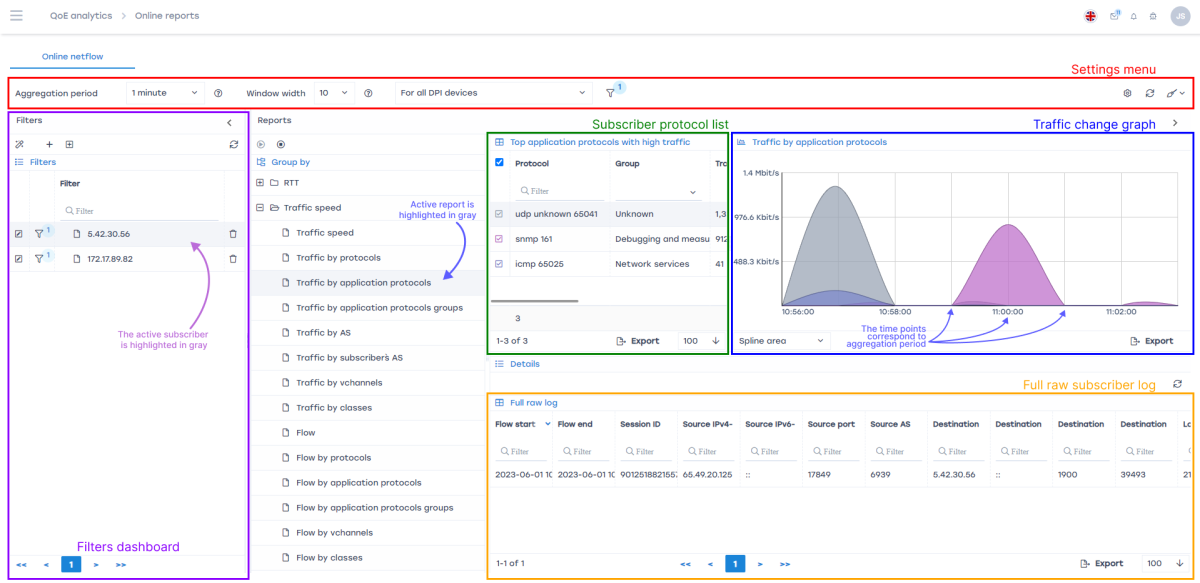
Example of the “Traffic by application protocols” report for a subscriber:
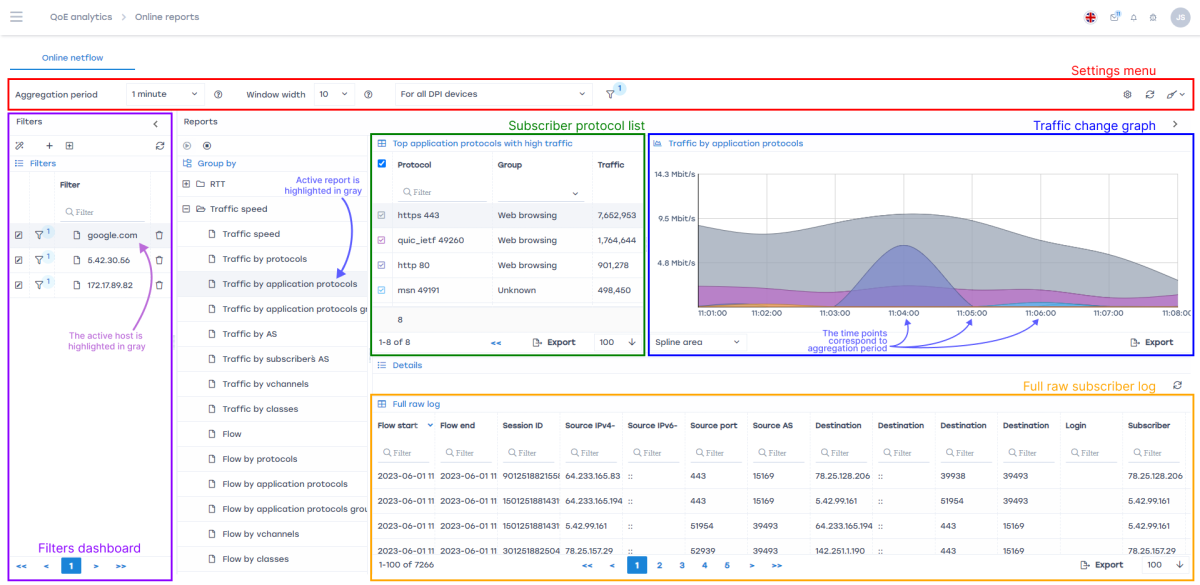
Example of the “Traffic by application protocols” report for a host:
Description of additional report settings
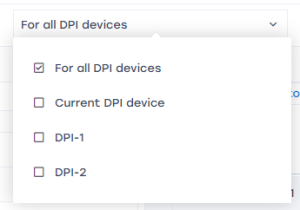
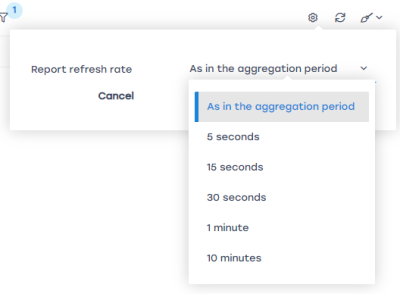
- Settings menu:
- Aggregation period — frequency of data updates.
- Window width — defines the “length” of the graph (number of data points). You can set a value from 1 to 30.
- Refresh.
- Protocol list — displays current subscriber/host protocols. The color of each protocol matches its line color on the graph.
- Traffic variation chart — displays protocol traffic graphically. The vertical axis shows traffic volume; the horizontal axis shows time.
- Full raw log — displays full information about the subscriber/host.
Data collection and aggregation setup
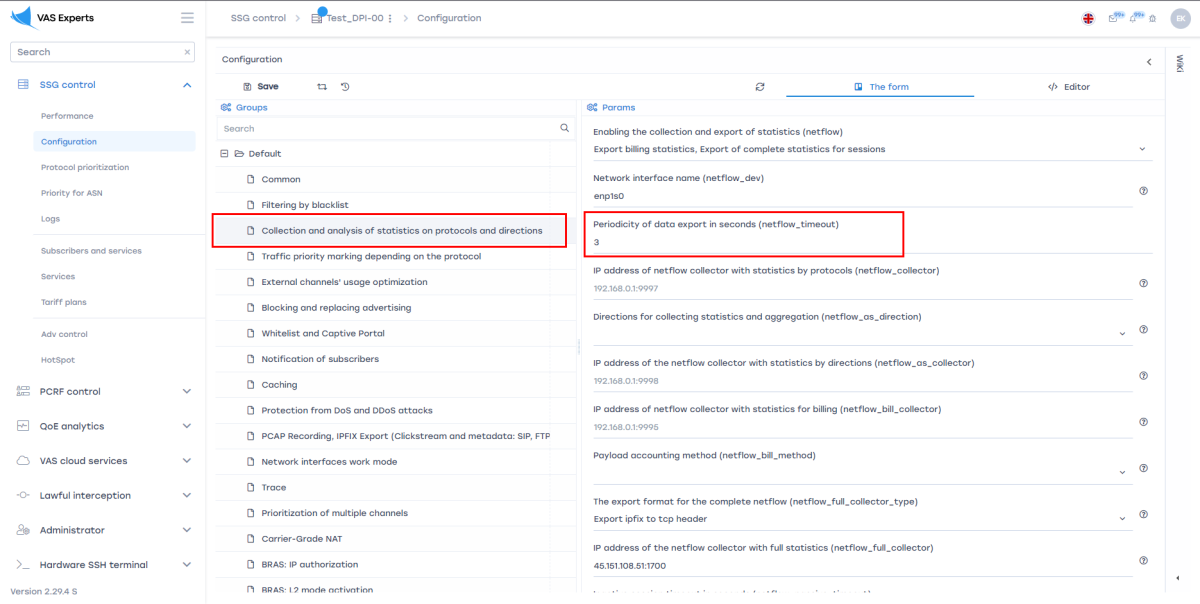
Step 1. On the sender side (DPI)
- Go to “DPI Management” → “Configuration”.
- In the “Groups” configuration, open “Statistics collection and analysis by protocols and directions”.
- In the “Parameters” configuration, change the “Data export interval in seconds (
netflow_timeout)” value. This value must be less than or equal to the rotation interval on the receiver side.
Step 2. On the receiver side (QoE)
- Go to “Administrator” → “QoE Stor Configuration”.
- In “Settings”, select “Receivers”.
- In the “Receivers” configuration, click the “pencil” icon (edit) and set each NetFlow receiver’s rotation period in minutes or seconds (the database load interval). We recommend setting one minute in the “Rotation in minutes” field. These values must be greater than or equal to the
netflow_timeouton the sender side!
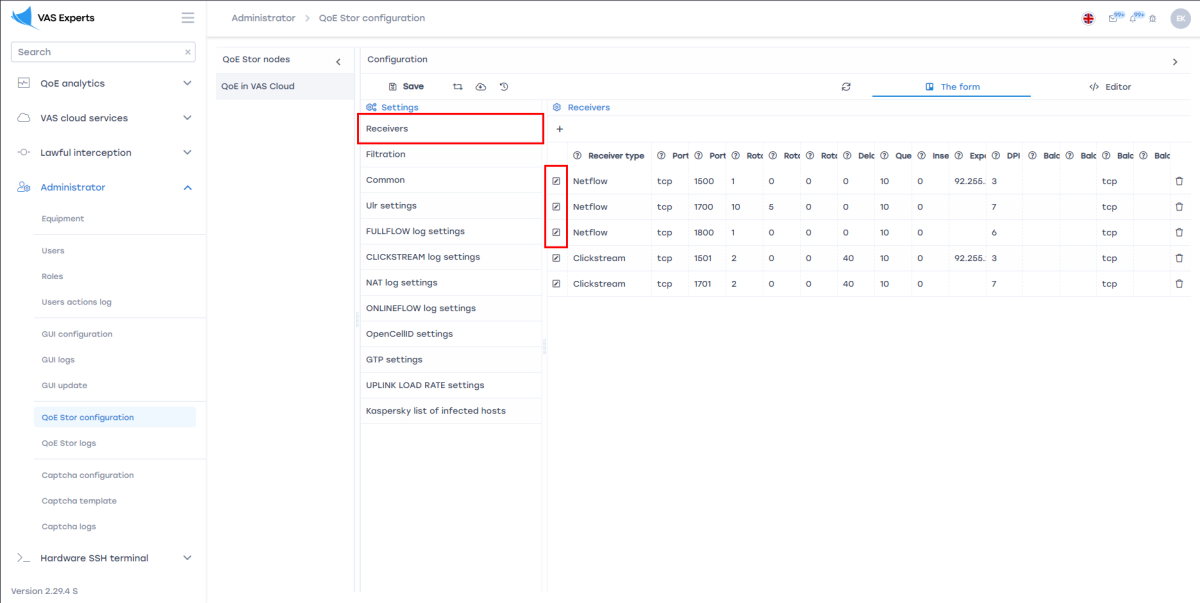
There are no strict limits on the rotation interval. Settings can be made in either minutes or seconds. Using both fields simultaneously is not allowed.
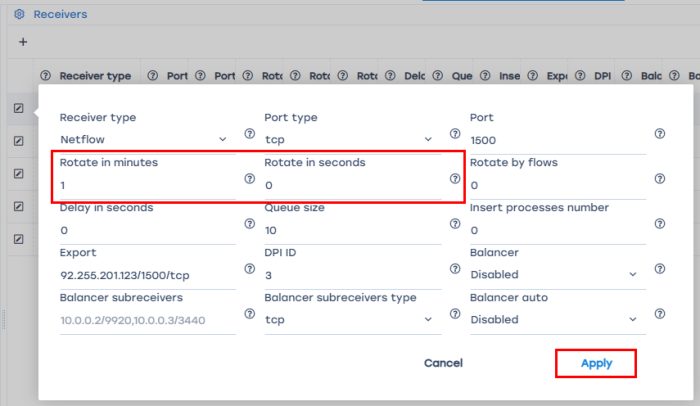
It is important to assign identical values to all NetFlow receivers!
After completing all setup steps, you can generate online reports.


